데이터 임상의학 w/ R (1)
Yoon-Ho Hong, MD, PhD
July 31, 2018
시작하기
데이터 의학이란?
의료정보학? 정보의학? 예방의학?
데이터 의학 = 데이터 과학 + 의학(기초, 임상)
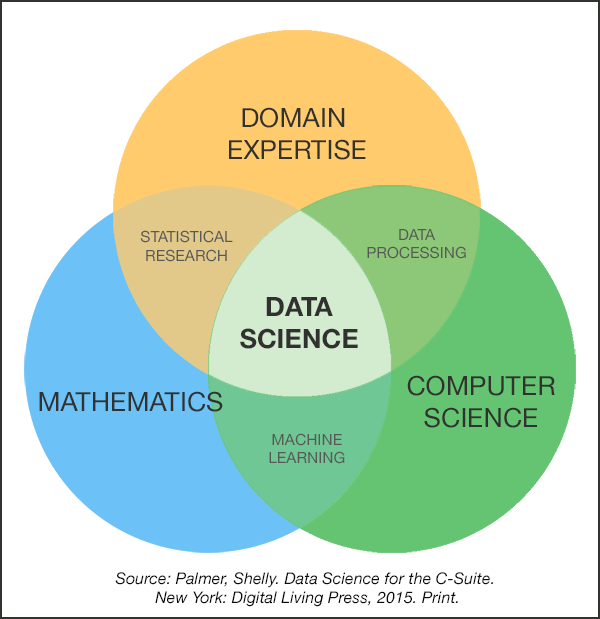
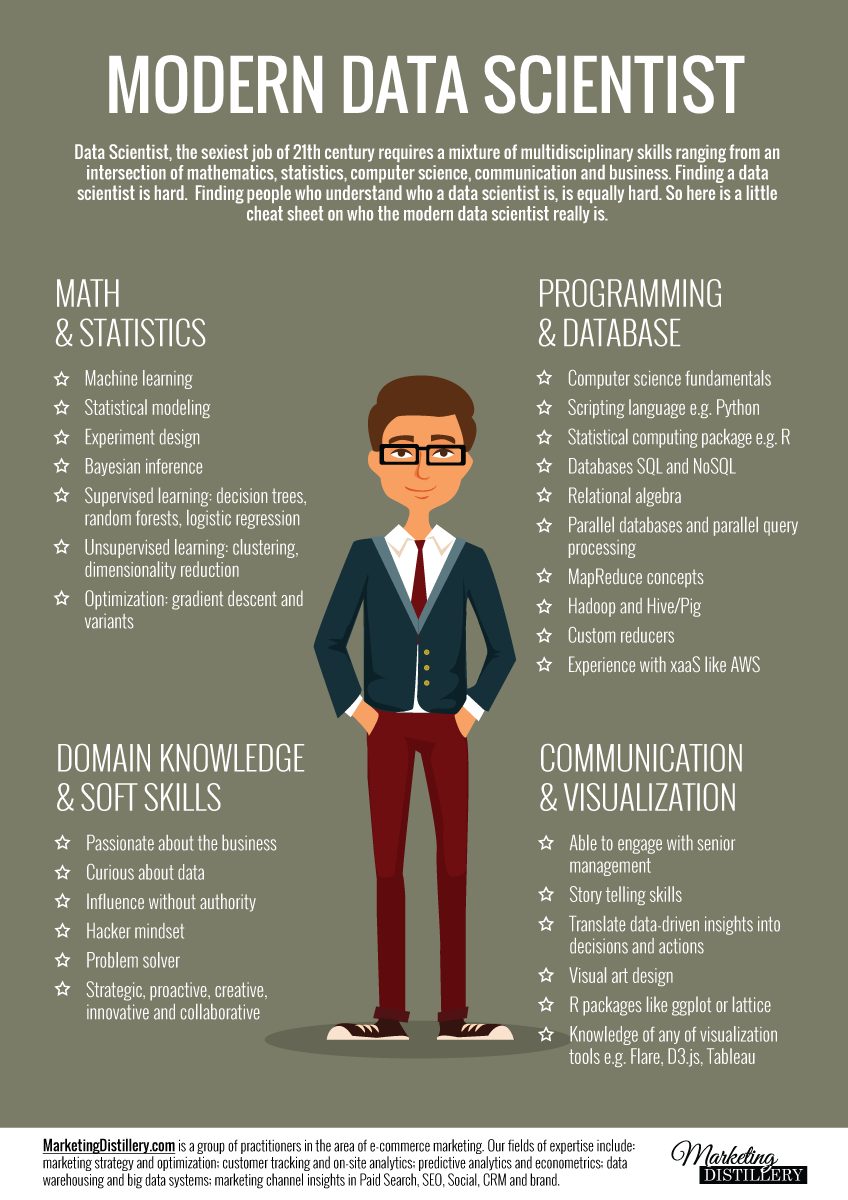
데이터 과학자는 누구인가?
Data scientist…
“Person who is better at statistics than any software engineer, and better at software engineering than any statistician”
- Josh Wills
데이터 의학자? 데이터 의사?
데이터 과학(의학?)으로 무엇을 할 수 있는가?
사례 1. Gapminder
지하철에서 경고 문구 Mind the gap!
세계관과 사실/데이터 간의 간극(gap)을 조심하고 좁히자는 이상을 반영(fact-based worldview).
The best stats you’ve ever seen by Hans Rosling
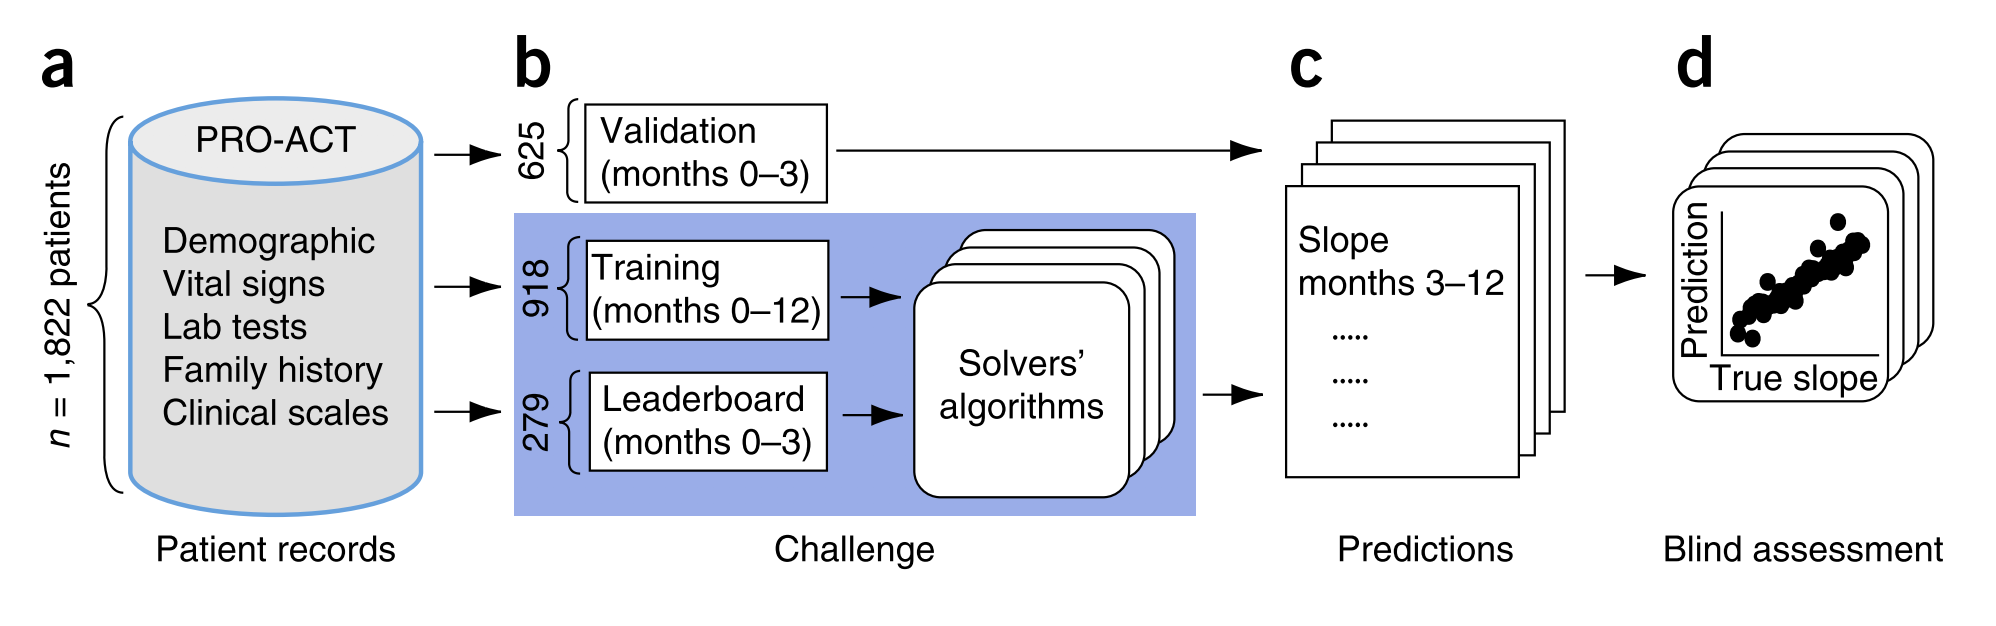
사례 2. PRO-ACT
Pooled Resource Open-Access ALS Clinical Trials Database
$50,000 crowd-sourcing challenge The DREAM Phil Bowen ALS Prediction Prize4Life Challenge
The challenge used a subset of the PRO-ACT database consisting of 1822 patients. Solvers had to develop an algorithm that used the first three months (time 0–3 months from trial onset) of clinical trial data available for a given patient to predict the slope of change in that patient’s disease over months 3–12 (based on a widely used functional rating scale: the ALSFRS. Measures of prediction success were RMSD and Pearson correlation.
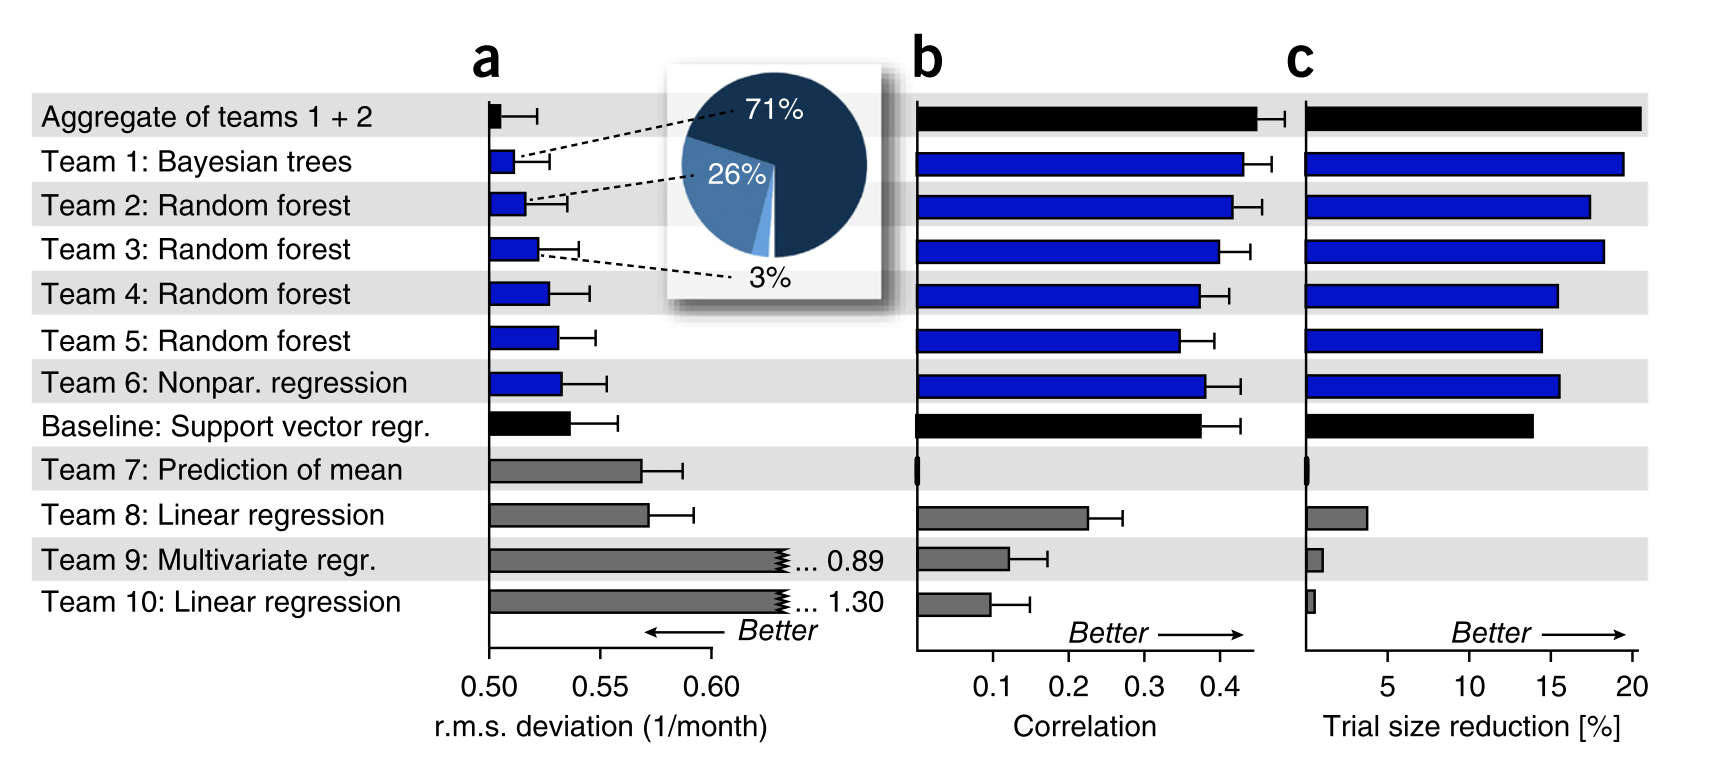
The frequency with which methods were ranked first is estimated across different bootstrap samples of patients. Teams 1 and 2 were ranked first in 71% and 26%, respectively, of the bootstrap samples (percentage rounded to the nearest integer)
You can read more about the specific challenge results in a publication summarizing the challenge: Küffner R, Zach N et al. Crowdsourced analysis of clinical trial data to predict amyotrophic lateral sclerosis progression. Nat Biotechnol. 2015 33:51-7
You can also read more about Dr. Hothorn’s approach in: Hothorn T, Jung HH. RandomForest4Life: a Random Forest for predicting ALS disease progression. Amyotroph Lateral Scler Frontotemporal Degener. 2014 15(5-6):444-52
데이터 과학의 workflow
문제 정의
문제가 무엇인가? (ex. 경제와 의료 수준의 상관 관계)
중요한 문제인가? 왜 그러한가?
통계적, 수리적 언어로 번역될 수 있는가?
데이터 정의
어떤 변수(variable, feature)들이 필요한가? (ex. GDP, 총인구수, 평균기대수명)
각 변수들은 어떤 타입(type)인가? (ex. 수치, 범주)
실험 계획 및 자료 수집
자료를 어떻게 수집할 것인가? (ex. 통제 실험, 공공데이터)
통제 실험(randomized controlled experiment)에서 각 실험,대조군을 어떻게 정의할 것인가? (수면제 A vs. 위약, 수면제 A vs. B)
자료의 크기는 어떻게 정할 것인가?
수집된 자료는 문제에 대한 답을 얻는데 적절한가?
데이터 가공
데이터 분석을 위해 적절한 표 형태로 가공하는 작업.
표 형태의 데이터에서 각 열은 변수를 나타내고, 각 행은 관측치를 나타냄.
탐색적 분석
기술 통계(descriptive statistics, 평균, 분산, 범위)와 데이터 시각화를 통해 이상치(outlier), 분포, 패턴(상관관계) 을 점검하는 단계.
모형화
어떤 모델을 적용할 것인가?
모델의 모수 추정, 가설 검정 등.
보고서 작성
시각화, 결과의 해석, 함의(implications)
재현가능한 연구(reproducible research) ex. R markdown.
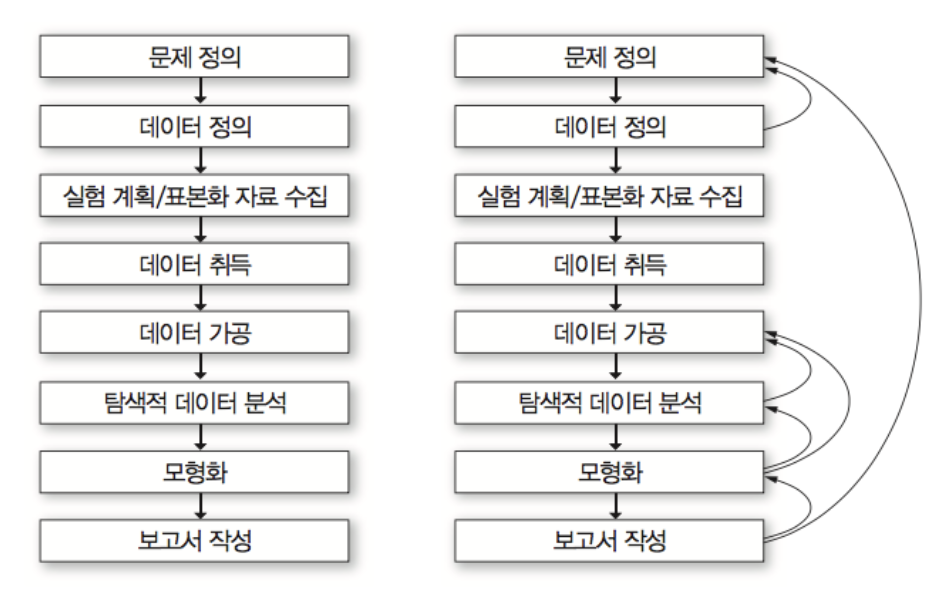
직선적인 과정이 아니라, 매우 반복적이고 순환적인 과정으로 이해해야 함.
Group work
Gapminder 웹사이트에서 각 대륙 각 나라의 의료 및 건강 수준이 경제, 교육, 환경 등 다른 요인과 어떤 관계를 이루며 변화해왔는지 탐색해보고, 한 가지 주제 (흥미로운 상관 관계, 현상, 통계치 등)를 정해서 발표해봅시다.
Individual work
성찰일지 (slack / #reflection channel 에 작성)